Clear data preparation and analysis will drive your business to the top - Part 2: The reporting solution for every business
From our last article on the topic of data preparation and analysis in your company, you know that companies that are ahead of the game in 2023 are relying on clean data preparation and central software to capture their data. This allows complex corporate data from a wide variety of internal, as well as external, sources to be brought together without additional effort - and to do so automatically, quickly and consistently. However, planning alone is not enough. In order for companies to make essential decisions, they must be able to prepare and evaluate their data quickly and clearly. For this purpose, BI tools that have sophisticated reporting dashboards are often called upon for support.
This is a sensible decision, as it allows selected data to be clearly displayed, analyzed and presented in the form of charts, graphs, heat maps and infographics. What we also know, however, is that by no means every company has in-house BI teams, let alone the know-how and time to create suitable and clear reporting dashboards for their various use cases themselves. In addition, each department needs different key figures, which in the best case are not considered separately, but are evaluated across departments.
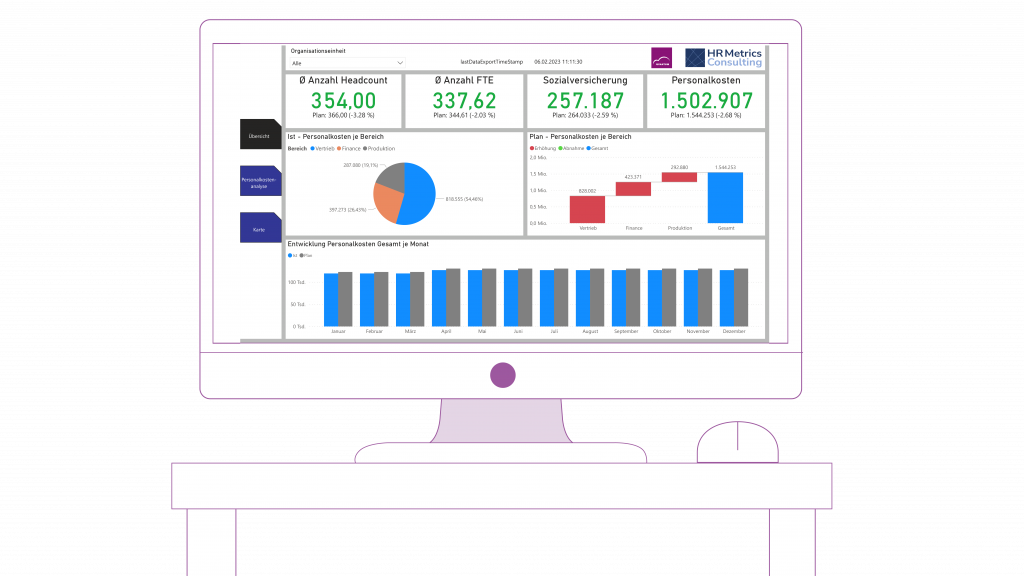
For this purpose, QVANTUM has an automated solution that allows you to perform quick analyses and reporting for cross-departmental controlling and measures. With the planning and reporting solution provided by QVANTUM, departments, and it doesn’t matter if they are team members or management, can understand the data that is important to them at a glance and present it transparently.

What you need so that your management can draw quick conclusions
Why are easy-to-understand and clear reporting dashboards so critical to your company’s success?
To answer this question, it helps to take a look at the day-to-day work of your departments. Companies often work with very complex amounts of data that they have to painstakingly prepare in order to make a quick decision.
In order to understand and evaluate the current data situation, whether it relates to your personnel costs or HR data, for example, department managers need to
- Quickly grasp the current status and any deviations
- Get a relevant overview of current data that they can present to the teams
- Know the status of the data that is most important to them in a very short period of time
- Understand their department’s data in relation to other departmental data.
And they can do this without having to know the detailed data from all the individual plans. After all, that should be the added value of digital planning and analysis tools: That your departments collaborate much more efficiently and get to the actions they need to take faster.

Incorporation of standard reporting dashboards into the management process
The solution offered by the software provider QVANTUM lies in the establishment of standard reporting dashboards that can be used by your departments without any prior knowledge. The HR department can thus perform a successful personnel analysis and correlate the results with other data such as general costs. In-house planning data is interfaced with BI tools so it’s always up to date.
How to use standard dashboards from QVANTUM without additional effort and BI experience
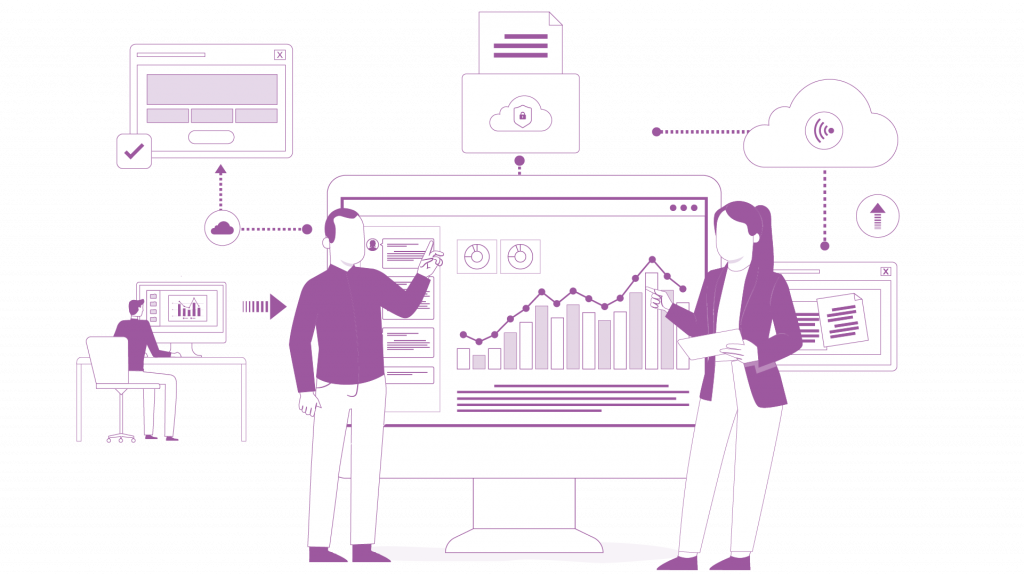
Here’s how: You plan in your central planning software QVANTUM and receive a ready-made standard dashboard for your various planning tasks such as personnel cost planning and personnel planning. Via interfaces, your QVANTUM planning can be actively connected to different BI tools. This way, your data from your entire QVANTUM planning is transferred to the BI tool in an agile way. The QVANTUM dashboard now, in turn, automatically obtains all the required and important key figures for your department (and in real time) via the interface to the BI tool and presents them clearly in the form of diagrams and infographics.

Do reporting dashboards from QVANTUM mean extra time & effort?
The answer is no. Your reporting dashboards are indeed connected to a BI tool to keep them always up-to-date. However, the transfer and preparation of your data in the QVANTUM dashboard is completely automatic and you don’t need additional staff or burden your employees with the tedious task of creating dashboards. In addition, QVANTUM offers you central cloud software for automated data collection for all your departments. It’s especially easy when you connect QVANTUM to Power BI. Because Power BI is often already used in companies as part of Microsoft 365.
Get a quick overview of all relevant data and share it easily with your teams
The main advantages of QVANTUM’s standard reporting dashboards are that they are designed specifically for your planning and can be used across departments. This means the HR manager can view all the HR data she wants. She can even relate it to personnel costs and total costs without having to plan and study all the cost centers herself or sit through meetings with the finance department.
The QVANTUM dashboards are:
- Adaptable to any company and any industry
- Time-saving due to a simple and quick insight into performance
- Flexible and individual in the design of the most important KPIs
- Maintained over long periods of time, giving you a solid data foundation
- Self-explanatory, providing cross-departmental value
- Always up to date due to their interface to BI tools and the planning data from the agile planning software.
Of course, you can share your dashboard with your team members on any device.

Conclusion
In addition to the central planning software and agile BI tools, understandable and up-to-date overviews in the form of agile reporting dashboards are needed so that company management, specialist departments and controlling can draw the right and, above all, quick conclusions from the mass of data. QVANTUM’s standard dashboards close the gap between your plan data and agile BI tools by making the desired data and answers for your use case and department accessible at any time.
You have the option to book a consulting appointment with us and we will create a suitable prototype including dashboards for your individual planning.


